Estimate the repeatability of a measure's scores across two time points.
Value
Dataframe with the coefficient of repeatability (CR), bias, the lower
limit of agreement (lowerLOA), and the upper limit of agreement
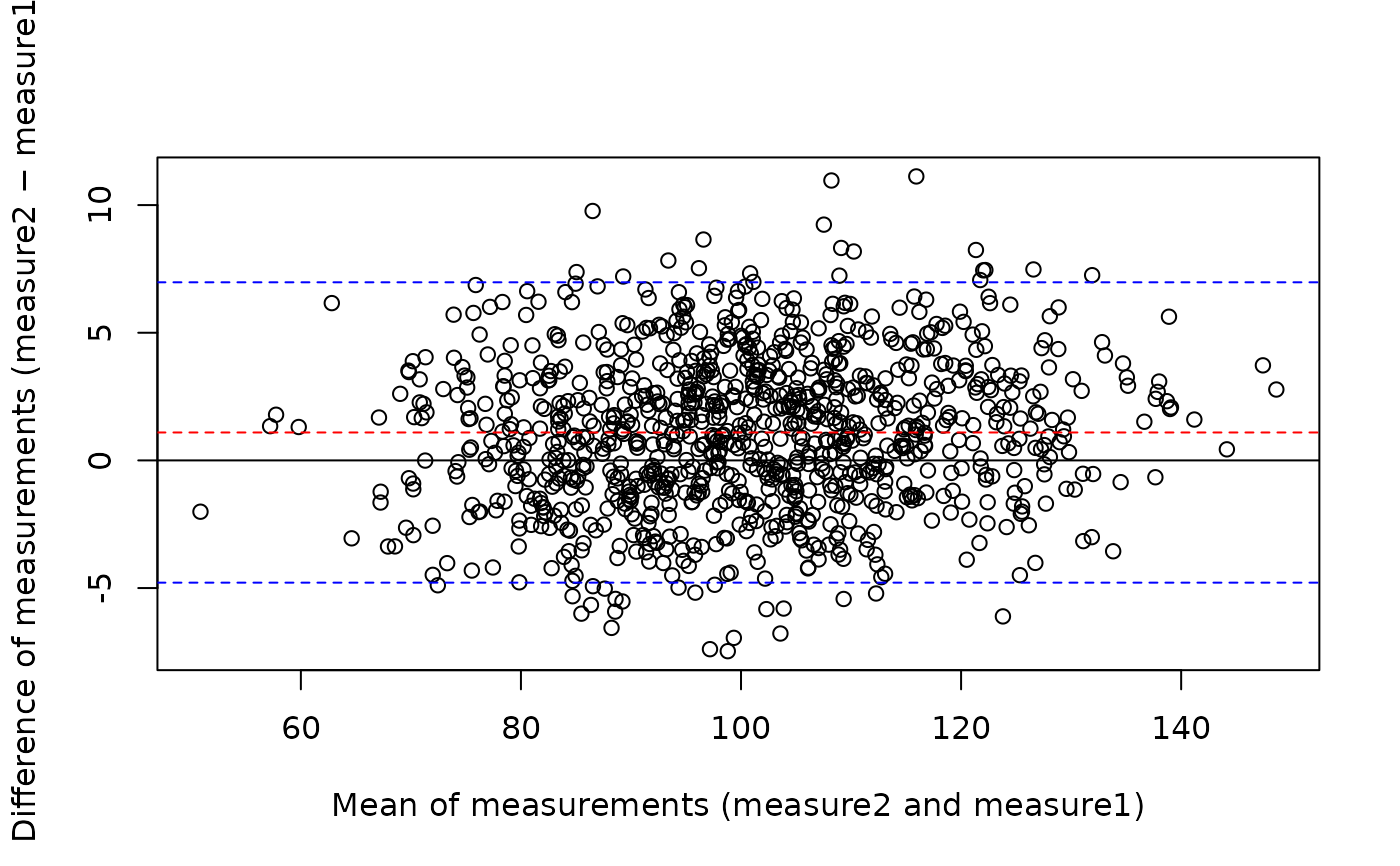
(upperLOA). Also generates a Bland-Altman plot with a solid black
reference line (indicating a difference of zero), a dashed red line
indicating the bias, and dashed blue lines indicating the limits of
agreement.
Details
Estimates the coefficient of repeatability (CR), bias, and the lower and upper limits of agreement (LOA).
See also
Other reliability:
reliabilityOfDifferenceScore(),
reliabilityOfProductTerm()

